The Ultimate Cash Flow Guide (EBITDA, CF, FCF, FCFE, FCFF)
All of the metrics are used in ratio analysis as comparative metrics used to arrive at a relative value.


EBITDA Vs. CF Vs. FCF Vs. FCFE Vs. FCFF
The earnings before interest, taxes, and depreciation & amortization (EBITDA), cash flow (CF), free cash flow (FCF), free cash flow to the firm (FCFF), and free cash flow to equity (FCFE) are some of the finance professionals' most frequently used metrics.
All of the metrics mentioned above showcase how much cash a business produces in one way or another. However, some metrics are better suited than others to show how much cash flow a business generates.
All of the metrics are used in ratio analysis as comparative metrics used to arrive at a relative value. In addition, some metrics like FCFF and FCFE are also used to arrive at an absolute value with DCF.
Cash flows are one of the most critical metrics for the business; they can be used to assess the overall quality of the business. If a business is generating high cash flows consistently, it is safe to assume that it is a high-quality business.
Cash flows are different from profits and are, in some cases, a better metric to judge a business, as the bottom line can be manipulated and is influenced by certain line items.
On the other hand, cash flows are much more challenging to manipulate and give an idea of how much cash the business has left after its capital expenses and working capital requirements are considered.
In this article, we will look at metrics that best represent the cash flows of a firm and how they are used in valuing the firm.
- EBITDA, CF, FCF, FCFF, and FCFE are key cash flow metrics used by finance professionals to assess a business's cash generation.
- CFO is a reliable metric showing cash generated by ongoing activities, used in liquidity and profitability ratios.
- FCF indicates leftover cash after expenses, reflecting business quality and maturity, used for valuation multiples.
- FCFF and FCFE are used in DCF valuation, considering all claim holders or equity shareholders, respectively.
- These metrics help gauge cash flow, business quality, and shareholder value-enhancing potential.
EBITDA
The Earnings before interest, taxes, and depreciation & amortization (EBITDA) is not essentially a cash flow metric but can be considered as one in certain circumstances. The EBITDA primarily replaces the net income as it is a better relative metric to value a company.
The issue with net income is that it is susceptible to changes in the tax regimes, depreciation rates, and interest rates, making it difficult to compare companies with varying tax, depreciation, and interest rates.
The EBITDA ignores taxation and adds back the interest and D&A to arrive at a more comparable metric.
Adding back interest means it also considers the company's debt, which means it is also taking the risk and leverage of the business into consideration.
The formula for calculating EBITDA is:
EBITDA = Net Income + Taxes + Interest Expenses + Depreciation & Amortization
EBITDA is not a measure of cash flow; instead, it is a measure of operating income, i.e., pre-tax income that adjusts for interest expense and depreciation and amortization expenses.
EBITDA is mainly used as a relative value metric; it can be used as a multiple like EV / EBITDA, EBITDA-to-sales, etc., Or a standalone metric to see year-on-year (YoY) or quarter-on-quarter (QoQ) growth.
EV / EBITDA: The enterprise value to EBITDA is probably the most valuation metric that uses EBITDA. It is, in a sense, an improvement in the P/E ratio. The enterprise value (EV) is the total market cap of the firm plus any debt the firm has less than any cash balances.
Enterprise Value = Market Value of Equity + Total Debt - Cash
EV/EBITDA is considered an improvement over the P/E ratio because it accounts for the firm's debt by considering interest expenses and total debt.
It is more comparable as it ignores taxation, so companies with different taxes can be compared. Finally, the non-cash expense of D&A is added to give a more accurate representation of the profitability, as non-cash expenses don't reduce the in-hand profits.
Cash Flow (CF)
Cash flow or cash from operations (CFO) is an accounting metric that shows how much cash is generated by the business by its ongoing business activities.
CFO is the only metric in this article readily available on the financial statements, cash flow statements to be specific. As it is an audited metric, it makes it very reliable.
The net income of the business is the base for calculating the CFO.
CFO is calculated on the cash flow statements by adding non-cash expenses like depreciation & amortization. Other expenses and adjustments are made for working capital and other short-term line items to the net income. As shown in the image below.
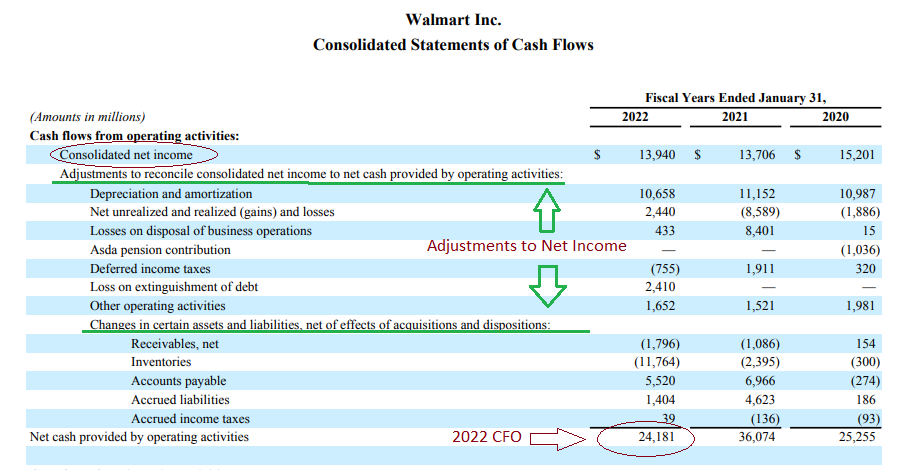
The CFO is truly a representation of the business's cash; cash flow from operation is then further used to fuel investments and finance cash flow.
Cash from operations is used in many ratios that assess risk, liquidity, and profitability ratios.
1. CAPEX to cash from operations ratio
This ratio determines how much capital the firm allocates for CAPEX from its CFO. It is a risk measure as it shows the capacity of the company to do CAPEX.
If the ratio is too low, the company is not doing CAPEX at its total capacity and thus is taking the lower risk.
A high ratio suggests that the company is doing large amounts of CAPEX. If the total CAPEX is more than the CFO, the company is taking on debt for its CAPEX, which increases the overall risk of the operations.
The operating cash flow ratio is a liquidity measure that measures how many current liabilities can be paid off by the operating cash flows generated by the business.
A ratio of 1 or above indicates that the firm can pay off all of its short-term obligations with the operating cash flows it generates.
The ratio is calculated by dividing the CFO by the current liabilities of the current year to get to a multiple.
The ratio is better used on a comparative basis than an absolute because some industries, due to their high working capital requirements, have higher short-term obligations making it impossible for the ratio to be 1.
So comparing the ratio of a firm with the industry or its peers will give a better estimation of the company's liquidity position.
3. CFO to net income
The CFO to net income is a forensic accounting metric that showcases the net profit being translated into actual cash that the business generates after non-cash expenses are added back, and working capital expenses are adjusted.
Generally, the CFO should be higher than the net income; if it is not, it raises a question about the quality of the business and the management and their inability to convert the profits into actual cash flow.
The ratio should be at least 0.8, meaning at least 80% of the profits are converted into cash flow, though a ratio of 1 and above is considered good.
Free Cash Flow (FCF)
Free cash flow, or FCF, remains of the net operating profits after tax (NOPAT) after the investment needs of the firm are taken care of.
FCF has 2 components to its calculation the NOPAT and Investment needs
FCF = NOPAT - CAPEX
NOPAT = EBIT * (1 - Tax Rate)
CAPEX = Net Property Plant & Equipment
So free cash flow is essentially what a company has remaining after its operating and capital expenditures are paid off. The NOPAT covers the Opex. NOPAT can also be replaced by the cash from operations (CFO) which has a similar effect, but it also adjusts for working capital.
The leftover cash can be used for dividend payouts, buybacks, other greenfield expansions and investments, acquisitions, etc. The free cash flow can be used to calculate multiples like the price-to-free cash flow, free cash flow yield, etc. FCF is an indication of the quality of the business.
Firms with high FCFs are termed high-quality businesses as they have excess cash left after their operating and capital expenditures are taken care of. It also can tell the maturity of the business.
Exhibit 1: Lockheed Martin Corporation (LMT) vs General Dynamics Corporation (GD)
Lockheed Martin 10-K
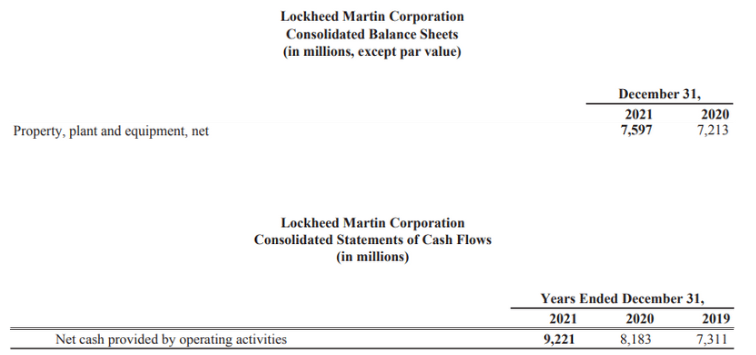
CAPEX = 7597 - 7213
CAPEX = 384
CFO = 9221
FCF = CFO + Capex
FCF = 9221 + 384
FCF = 9605
Lockheed Martin has a free cash flow of $ 9.6 billion.
LMT has a total market cap of $117 billion, so the:
Price-to-FCF (P/FCF) = 12.00x
FCF Yield = 8.20%
General Dynamics Corporation 10-K
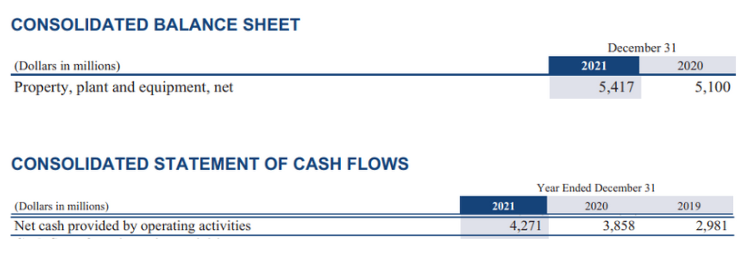
CAPEX = 5417 - 5100
CAPEX = 317
CFO = 4271
FCF = CFO + CAPEX
FCF = 4271 + 317
FCF = 4588
General Dynamics has a free cash flow of $4.5 billion.
GD has a market capitalization of $64 billion, so the:
Price-to-FCF (P/FCF) = 14.22x
FCF yield = 7.03%
LMT has a lower P/FCF value of 12 vs 14.22 of GD and has a higher FCF yield of 8.2% vs 7.03% of GD. So on a free cash flow basis, LMT has a cheaper valuation.
But both the firms have a P/E of 19, so it can be said that Lockheed Martin is at a cheaper valuation than GD Corp, even though the P/E of those firms are the same.
Free Cash Flow to Firm (FCFF)
Free cash flow to the firm (FCFF) or unleveled free cash flow is the sum of the cash flows to all claim holders in the firm, including shareholders, bonds & preferred stockholders.
FCFF is essentially the cash that remains after the capital expenditures (Capex), the net working capital expenses are taken care of, and the depreciation is added back. As it considers that the company's creditors have not paid back, it uses the net operating profits after tax (NOPAT).
The formula for FCFF is:
FCFF = NOPAT + D&A - Capex - △NWC
NOPAT = EBIT * (1 - Tax Rate)
D&A = Depreciation & Amortization
Capex = Net Property Plant and Equipment
△ NWC = Change in Net Working Capital
FCFF is the key to calculating the absolute intrinsic value of a firm through the discounted cash flow (DCF) method. FCFF is the preferred DCF variable for companies with debt on their balance sheet as it includes bondholders in the cash flow calculation.
The method used for calculating the cost of capital for FCFF is the weighted average cost of capital (WACC) which is a weighted avg of the cost of equity (Ke) and the cost of debt (Kd). The cost of debt (Kd) is simply the post-tax percentage of interest that the firm pays annually.
The cost of equity is a return that a firm theoretically pays to its investors; even though it does not actually pay anything to use the equity capital, it has to have a cost associated with using it.
There are a few methods used to estimate a firm's equity cost, but the capital asset pricing model (CAPM) is the most used and accepted one.
CAPM = Rf + β * (ERP)
Rf = Risk Free Rate
β = Beta of the stock
ERP = Equity Risk Premium
The equity risk premium is an expected return earned by the investors earned over and above the risk-free rate in the stock market.
ERP can be calculated by subtracting the expected market returns E(Rm), which can be calculated by looking at the historical data by the current risk-free rate.
ERP = E(Rm) - Rf
Microsoft Corporation (MSFT)
Exhibit 1: Cost of Equity
Beta = 0.94
Rf = 2.94
ERP = 4.24
CAPM = 2.94 + 0.94 * 4.24
CAPM = 7%
Therefore, the cost of equity (Ke) for MSFT is 7%
Exhibit 2: Free Cash Flow to Firm (FCFF)
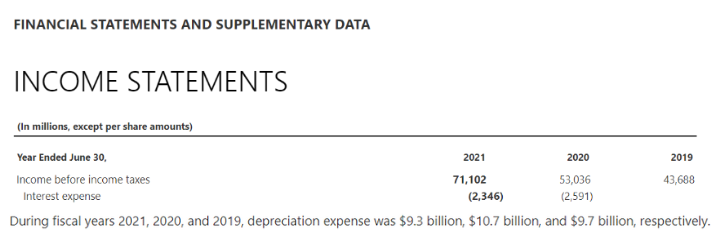
US corporate tax rates are 21%
EBIT: To calculate EBIT, we need the before-tax profits (PBT) and interest expense which are provided in the above images.
EBIT = PBT + Interest Expense
EBIT = 71102 + 2346
EBIT = 73448
NOPAT = EBIT * (1 - Tax Rate)
NOPAT = 73448 * (1 - 21%)
NOPAT = 58024
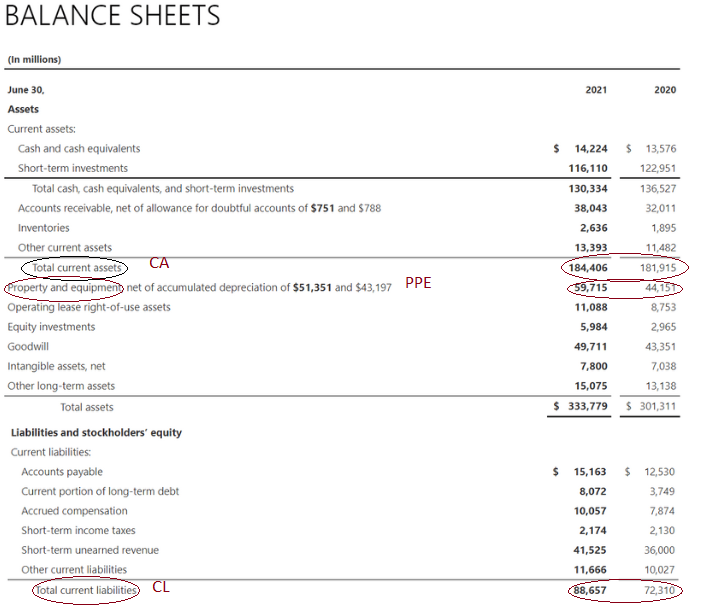
CAPEX = 2021 PPE - 2020 PPE
CAPEX = 59715 - 44151
CAPEX = 15564
Change in NWC = (2021 CA - 2021 CL) - (2020 CA - 2020 CL)
Change in NWC = (184406 - 88657) - (181915 - 72310)
Change in NWC = (-13856)
D&A = $9.3 billion or 9300 in millions
FCFF = NOPAT + D&A - Capex - Change in NWC
FCFF = 58024 + 9300 - 15564 - (-13856)
FCFF = 65616
For the fiscal year 2021, Microsoft has shown a free cash flow to the firm of $65 Billion. This suggests that Microsoft will have $65 billion in 2021 after Opex, Capex, and NWC requirements are fulfilled.
The $65 billion can now be used to repay debt holders, share repurchases, dividends, and other investments.
Free Cash Flow to Equity (FCFE)
The free cash flow to equity (FCFE), like FCFF is another type of free cash flow used in discounted cash flow (DCF) valuation.
FCFE, unlike FCFF, considers that the company's bondholders and debtors are paid off along with Capex and net working capital requirements. FCFE measures the cash flow available to the company's equity shareholders.
The free cash flow to equity or the firm is used as a replacement for dividends, as dividends, in the true sense, are the cash flows a company pays to its investors.
However, not all companies pay dividends, or even if they do not all pay it at their total capacity, the FCF replaces dividends. The FCFE can be used in shareholder-enhancing activities like buybacks, dividends, or other investments.
A company with solid and consistent FCFEs is considered a high-quality business because it has excess cash remaining after its operation & investments expense and after repaying its debt holders.
The cost of capital used for FCFE will be the cost of equity (Ke); as debt is considered paid, there is no need to consider the cost of debt (Kd).
FCFE can be calculated in a few ways:
FCFE = Net Income + D&A - Capex - △NWC + Net Borrowings
D&A = Depreciation & Amortization
△NWC = Change in Net Working Capital
Net Borrowings = Amount Borrowed - Amt Repaid
The net borrowings can be found in cash from the financing section of the cash flow statements. Net borrowings are added back because after the debt for the year is repaid, the remaining cash will be available to the shareholders to dispense.
FCFE = FCFF - [Interest * (1 - Tax Rate)] + Net Borrowings
FCFF can be used to calculate FCFE because their formulas are primarily the same FCFE adds net borrowings and reduces the interest. So if adjusted accordingly, FCFE can be calculated out of the FCFF.Taking the same MSFT example, we got an FCFF of $65616 million
The interest pmt for 2020 was: $2346 million. Net borrowings for MSFT were:
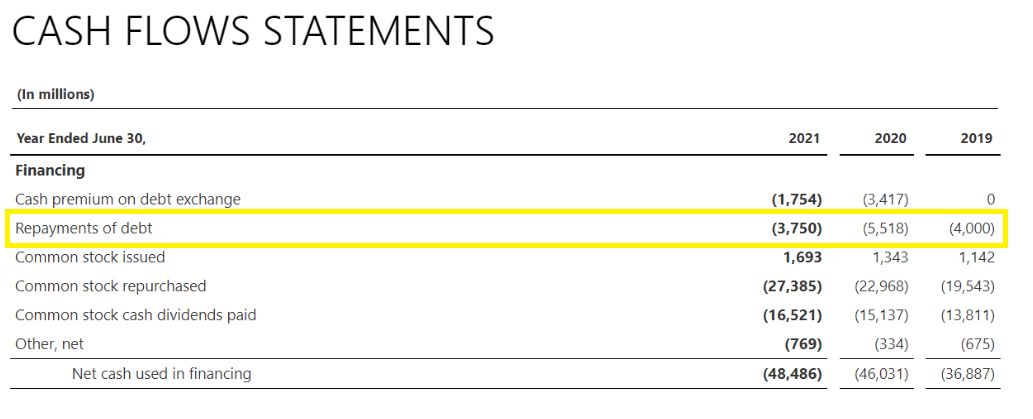
The company did not take any new debt in 2021, so the net borrowings will be:
$-3750 million
FCFE = FCFF + [Interest * (1 - Tax Rate)] + Net Borrowings
FCFE = 65616 + [2346 * (1 - 21%)] + (-3750)
FCFE = 63719
Microsoft's free cash flow to equity of $63 billion for 2021. The cash flow can be used for shareholder value-enhancing activities like dividends & buybacks, or the company can also make investments with these.


or Want to Sign up with your social account?