Credit Analysis Ratios
The mathematical tools used to determine an organization's creditworthiness.


What Are Credit Analysis Ratios?
Credit Analysis Ratios are the mathematical tools used to determine an organization's creditworthiness.

Public companies can raise capital by issuing shares, bonds, or debentures. Another method commonly used by companies to raise funds is by securing bank loans.
Credit analysis is the step taken before an investor or bank extends its capital to a company. Investors and banks must assess the company's creditworthiness before lending.
Credit risk is the probability that the borrower will not reimburse the bank with the principal and interest. The most recommended technique for mitigating this risk is undertaking credit analysis and applying effective credit risk management techniques.
Credit Risk Analysis (CRA) is the process by which the company's ability to repay the principal and interest is assessed. It is a type of financial analysis that helps to understand the default probability of a debt-issuing company.
Note
The investor or bank must exercise due diligence on the company before extending credit. Due diligence can be exercised by evaluating both quantitative and qualitative tools.
In this article, we will only be discussing quantitative tools. These tools are ratios or percentages that assess the financial creditworthiness of the company.
- Credit analysis ratios are financial metrics used to assess a company's ability to meet its debt obligations, providing insights into its creditworthiness and financial stability.
- Key credit analysis ratios include liquidity ratios (e.g., current ratio, quick ratio), leverage ratios (e.g., debt-to-equity ratio, interest coverage ratio), and profitability ratios (e.g., return on assets, return on equity).
- These ratios measure a company's ability to cover short-term liabilities with its short-term assets. A higher ratio indicates better liquidity and a lower risk of default.
- These ratios assess the degree of a company's financial leverage and its ability to meet long-term debt obligations. A lower leverage ratio generally indicates lower financial risk.
How to Conduct a Credit Risk Analysis (CRA)?
CRA can be conducted by analyzing the company’s credit history, reviews from creditors, and credit ratings. Other procedures include cash flow analysis and forecasts, trend analysis, financial estimates, and ratios.

CRA provides insights into the financial well-being of an economic entity. Its role has strengthened since the 2008 Global Financial Crisis. As a result, many enterprises have invested in techniques for risk management, and credit risk management systems were the primary focus.
It is difficult to assess whether a company would default accurately. Companies could go through financial difficulty unexpectedly, resulting in economic instability. However, by closely analyzing the probability of default, an investor or a portfolio manager could reduce the extent of the loss.
The lenders could be investors, portfolio managers, or banks. They all can undertake a credit analysis. However, lenders analyze credit risk in different ways.
Lenders can take a fundamental credit risk assessment by analyzing the company's previous credit history and reviews. Avoiding investing in a company with a weak credit history and negative reviews is safer.

Another measure could be to inspect the credit rating of the company. Credit agencies issue credit ratings. They evaluate the risk of investing in an economic entity. The rating associated with an entity could be updated based on the banks' continued risk review policy.
The top credit agencies include Moody’s, Fitch, and Standard and Poor’s (S&P).
Each agency uses a different, although similar, rating scale per investment grade. For example, the highest investment grade in Moody’s is Aaa, while, in S&P, it is AAA. The poorest quality in Moody’s gets a C and a D in S&P.
Note
Companies with lower ratings generally offer higher interest rates to attract investors; however, it is recommended not to invest in such companies.
Other quantitative methods a lender could use are
- Cash flow analysis and forecasts,
- Trend analysis,
- Financial estimates, and
- Financial ratios
Discussed below are the various financial ratios that creditors evaluate before lending money to a borrower.
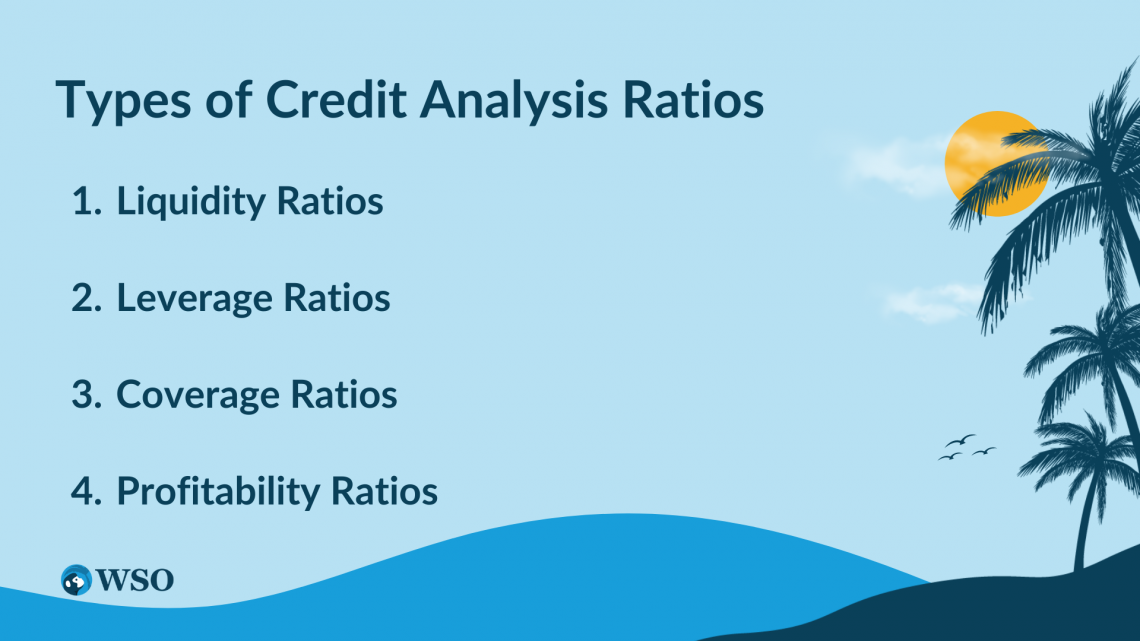
Types of Credit Analysis Ratios
A qualitative aspect of credit analysis involves analyzing financial ratios. Ratios are performance indicators that indicate a company’s financial position. Ratios are arithmetic expressions of the relation between two factors.
Financial ratios could indicate factors like the company's efficiency, financial capabilities, and return on investment.
There is a wide range of ratios that can be calculated. These ratios can be grouped into the following categories:
- Liquidity ratios,
- Leverage ratios,
- Coverage ratios, and
- Profitability ratios
A company's financial statements provide the information required to compute these ratios. The company's financial statements include the balance sheet, income statement, cash flow statement, changes to equity, and notes to financial statements. Even the forecasts of these statements could be used as financial data.
It is advised that investors calculate such ratios as they could indicate potential solvency problems. Apart from that, a company’s health can be determined using ratios. In addition, lenders can compare a firm's financial structure and profitability to its competitors.
Credit Analysis with Liquidity Ratios
A company must be solvent in order to survive. Liquidity is the ability of a company to be able to meet its short-term obligations. Examples of short-term obligations could be to pay wages, interest on bank loans, or lease payments. Liquidity only focuses on the short term. It measures how easily a business can generate cash from an asset.
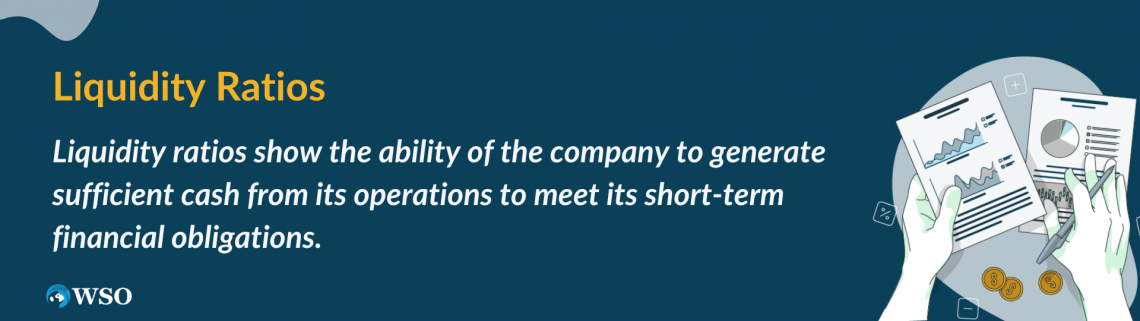
Liquidity ratios show the company's ability to generate sufficient cash from its operations to meet its short-term financial obligations.
By analyzing the ratio, an investor could answer questions like whether the company has operational or adequate liquidity to survive in the short term.
For credit risk analysis, the liquidity ratios assist in the evaluation of the financial standing of the company. For example, they indicate whether a company could repay debt while remaining solvent in the short term. Lenders can also scrutinize the cash availability to reimburse interest payments.
While calculating liquidity, two crucial balance sheet items are considered. These are current assets and current liabilities.
Current assets are the company's resources projected to be turned into cash within one year or an operational cycle, whichever comes first. The operating cycle is between inventory acquisition and its final sale. It is generally for one accounting period or a year.
Note
On the balance sheet, the current assets are displayed in descending order of liquidity. The most liquid assets prevail over the least liquid assets. It begins with cash and cash equivalents, short-term securities, accounts receivable, inventories, and prepaid expenses.
Current liabilities are the debt obligations expected to be reimbursed within one year or an operating cycle, whichever comes first. Balance sheet items for current liabilities include accounts payable, salaries & wages, income taxes, and accrued interest.
a) Current Ratio
The current ratio is the percentage of assets that can be used to generate cash compared to short-term obligations.

Current Ratio = Current Assets / Current Liabilities
It is the most popular ratio used to measure liquidity. A very high ratio indicates that a company’s assets may be left idle, and there are few investments in new projects.
A low current ratio indicates that a company cannot sustain itself for the short term or that the assets cannot be utilized efficiently to meet short-term obligations. As a result, companies with low ratios have a high credit risk. Therefore, it is advisable not to lend any money to them as the probability of default is high.
b) Quick Ratio (Acid Test)
The quick ratio measures the ability of a company to use its most liquid assets to pay off its short-term debts.

Quick Ratio = (Current Assets - Inventories - Prepaid Expenses) / Current liabilities
The company's most liquid assets are cash, short-term securities, and accounts receivable. This ratio is a conservative extension of the current ratio and accurately represents the company's liquidity.
Inventory and prepaid expenses are not considered the most liquid assets, as the business would require sufficient time to convert them into cash. Even accurately guessing the value of the inventory is a tedious task.
c) Cash Ratio
The cash ratio measures the ability of the company to repay its short-term financial obligations by only using cash.

This is a more conservative approach to the current ratio.
Cash Ratio = Cash and cash equivalents / Current liabilities
The cash equivalents, in this case, are the short-term money market instruments. These instruments expire within one year and are thus very liquid. Money market instruments include T-bills, stocks, and bonds.
It is recommended to maintain a ratio at or above 1. It indicates that the company can repay all its short-term debts using only cash. Lenders should look for companies with a cash ratio above 1.
d) Net Working Capital Ratio
The measure indicates the amount left if all its liabilities were paid. Working capital is the difference between the current assets and the current liabilities.

The working capital ratio measures the number of short-term liabilities the assets cover.
Net Working Capital Ratio = (Current Assets - Current Liabilities) /Total Assets
It is desirable to have a higher net working capital ratio. A lower ratio indicates that the company has a high proportion of investments in long-term assets, which negatively affects the liquidity of the company.


Credit Analysis with Leverage Ratios
A company can raise capital through a combination of debt and equity. Raising capital through equity implies that a company issues shares to the public. While undertaking, debt suggests that a company finances its operations using loans or debentures.
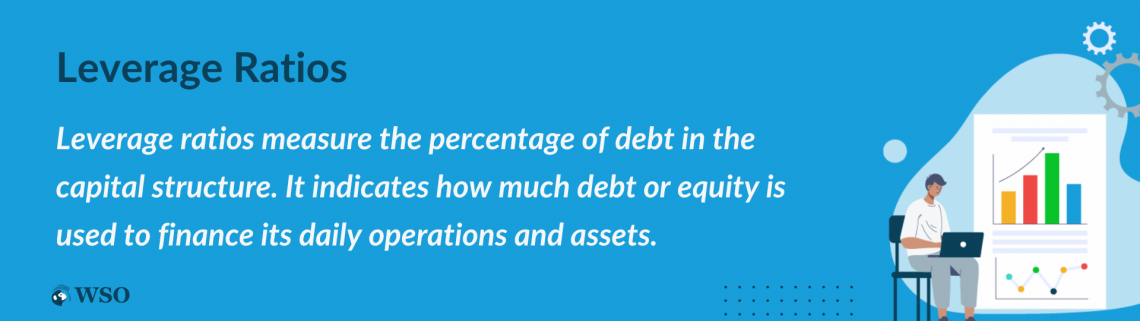
Leverage ratios measure the percentage of debt in the capital structure. It indicates how much debt or equity is used to finance its daily operations and assets.
A company that undertakes excessive debt would be subject to paying timely interest payments. These payments are taken out of the profit. Suppose the company is going through financial difficulties and its profits decline considerably. The lenders must still make interest payments regardless of their economic conditions.
Note
These ratios are significant for credit risk analysis as they indicate whether a company can remain solvent for the foreseeable future. It also analyses the company’s ability to repay its debts.
It can help lenders decide the interest rate to charge. For example, companies with higher debt would attract higher interest rates, and accommodating high-risk Companies with more equity would attract lower interest rates.
The below ratios are essential types of leverage ratios.
a) Debt to Equity
The Debt to Equity ratio measures the amount of debt relative to the equity. It is a direct comparison to detect the leverage.

Debt to Equity = Total Debt / Shareholder’s Equity
It reflects the company’s ability to repay long-term debt. A low ratio is preferable as it indicates that the company is not relying on much debt, and potential creditors will be paid on schedule.
By using this ratio, investors can undertake an easy competitor analysis. The competitors can be evaluated based on their leverage, and the company with the lowest ratio is the most credit-worthy.
b) Debt to Capital
The Debt to Capital ratio measures the amount of debt compared to the total capital. It indicates the amount owed to creditors in the capital structure.

Debt to Capital = Total Debt / Total Capital
Having a low ratio suggests that the firm raises its capital through equity and has fewer claims on its assets during liquidation.
Lenders select companies with a lower ratio because that company can repay its loans on time and would not have a foreseeable solvency issue.
c) Total Debt to Assets
The Debt to Assets ratio measures the number of creditors' claims on the company’s assets. It measures the degree of leverage by indicating how much of the assets could be used for debt repayments.

Debt to Assets = Total Debt / Assets
A company with ratios equal to or above 1 suggests that every asset must be used to repay debts. This is a negative indicator due to the high leverage.
A ratio below 1 is preferable as all the assets would not be required to service the debt. Instead, the company could use excess assets for growth opportunities.
Credit Analysis with Coverage Ratios
A company must repay its interest obligations from the profit generated. A financially sound company can meet its obligations for the long term without cash flow difficulties.
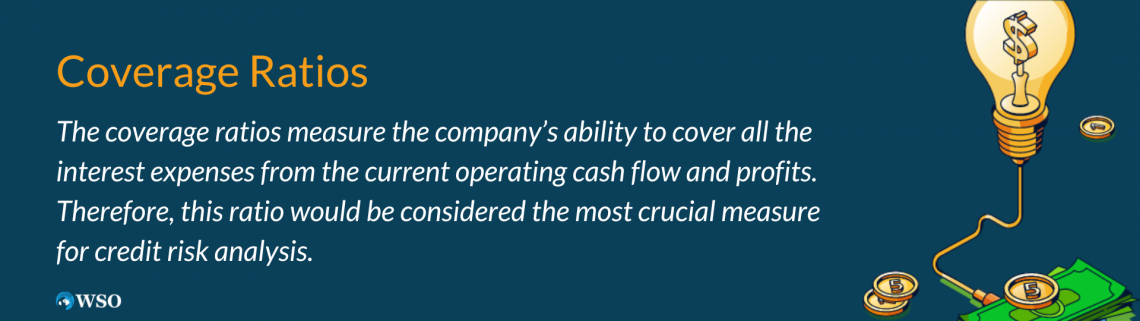
Coverage ratios measure the company’s ability to cover all interest expenses from current operating cash flow and profits. Therefore, this ratio would be considered the most crucial measure for credit risk analysis.
A higher ratio denotes that a company can cover all its debt obligations with earnings and assets. The firm's long-term solvency is scrutinized. The coverage ratio indicates that the company can comfortably meet its interest payments using its profits.
Banks usually mention a covenant in loan agreements for companies to maintain a minimum coverage ratio. If a company fails to do so, the loan agreement may be canceled.
The below ratios are used to measure the firms' coverage ability.
a) Interest Coverage Ratios (ICR)
The ICR uses earnings to measure the firm’s ability to meet its interest expenses. The only focus here is the ability to repay the interest.

ICR = EBIT / Interest Expense
The earnings are the income before deducting the interest and tax payments. Therefore, the net income should not be used to evaluate the firm's ability to pay its interest.
It is recommended to lend to companies with a higher ratio. This is because companies with a high ratio can reimburse all interest payments from earnings.
b) Debt-Service Coverage Ratios (DSCR)
The DSCR measures the firm’s ability to repay long-term loan obligations, i.e., principal and interest.

It can also be called the Debt Coverage Ratio (DCR). It is the most important coverage ratio to determine the company’s financial strength.
DSCR = EBIT / Debt Service Charges
Debt service charges include the principal, interest, and leases. Therefore, a ratio above 1 is desirable as the company could repay all its obligations from its earnings without absorbing them entirely.
Loan agreements particularly mention a minimum DSCR to be maintained. It ranges from 1.1 to 1.25 depending on the loan size and other factors.
c) Fixed Charge Coverage Ratios (FCCR)
The FCCR measures the company’s ability to utilize its earnings to cover loan charges like interest, principal, and other expenses.

FCCR = (EBIT + Fixed Charges) / Fixed Charges
The company’s creditworthiness can be judged using the ratio. The higher the FCCR, the higher the creditworthiness, and vice-versa.
It is recommended to have a ratio above 1 to be viewed as a financially healthy company. A company that can meet all its expenses through its earnings is considered efficient. As a result, they could attract lower interest rates.
On the other hand, a ratio below 1 indicates that the earnings cannot cover the expenses leading to solvency problems.
Credit Analysis with Profitability Ratios
Profitability ratios measure a firm's capability to use resources to generate profits. Resources are assets or capital the company possesses. The firm must also have a solid operation to profit. This ratio is closely related to efficiency ratios.

By analyzing this ratio, the investor can understand the company's profitability and interpret the primary profit sources. Profit should be adequate for its size and turnover. In addition, the investor can determine whether the company can grow long-term.
A company must be able to profit from its operations to honor its financial obligations. Therefore, the company should maintain an appropriate profit margin to remain a going concern. A rational investor would not fund a company that is at a loss or could be a loss-making venture.
There are two categories of profitability ratios - margin and rate of return. Below are the categories listed and the types of profitability ratios.
Margin ratios are a kind of profitability ratio that measure a company’s profits regarding the sale of goods or services. Margin is the difference between the revenue generated from a sale and its related expenses. Lenders can only find the financial data required to compute the ratios below in the income statement.
The rate of return ratio is a type of profitability ratio that measures the profits attributed to company shareholders. It indicates the ability of management to generate returns for shareholders on their investments.
a) Gross Profit Margin
The gross profit margin ratio determines the percentage of revenues that remain with the company after expenses for the merchandise are deducted.

Gross Profit Margin = (Net Sales - Cost of Goods Sold) / Net Sales
It is favored that the gross profit margin and the sale have a proportionate increase or decrease. For example, suppose there is a 20% increase in sales. Then, it's vital that, at a minimum, gross profit increases by 20%.
A higher gross profit margin is advantageous as it indicates that the company is selling the goods at a price that can effectively cover the costs while leaving a reasonable proportion of earnings. Conversely, a low-profit margin could indicate higher costs or lower selling prices.
The operating profit margin measures the firm's operational efficiency.

Operating Profit Margin = Operating Profit / Net Sales
Operating profit is earnings before applying interest and taxes. Operating profit is also called EBIT or Earnings before Interest and Taxes. To obtain EBIT, all expenses, including the provisions of depreciation and amortization, are deducted from the revenue.
The operational margin depicts the management's strengths in controlling expenses. Therefore, a higher operating profit ratio is a good signal of operational efficiency.
Earnings before Interest, Taxes, Depreciation, and Amortization (EBITDA) margin measures profits as a percentage of revenue.

EBITDA Margin = EBITDA / Net Sales
An investor must subtract operational expenses from revenue to arrive at EBITDA. The earnings are estimated by deducting the COGS, selling, and administrative costs. Depreciation and amortization, which are non-cash expenses, are added to the earnings.
The operational performance of an entity can be determined using this ratio. This operating performance can be utilized as a comparison tool at an operational level.
d) Net Profit Margin
The Net Profit Margin Ratio measures the fraction of revenue that remains with the company after all the expenses, including interest and taxes, are deducted.

Net Profit Margin = Net Profit / Net Sales
It is an essential indicator of the company’s financial health. Monitoring this ratio is crucial as the company can understand whether its business practices can generate profits.
A higher ratio is a positive sign, showing that the company can generate adequate profits to cover its expenses, and the excess can be invested in new projects.
e) Return on Assets (ROA)
Return on Assets measures how effectively the assets are utilized to generate profits for the company.

Return on Assets = Net Income / Average Total Assets
It can be inferred as the profit generated per dollar asset the company owns. Lenders use this ratio to evaluate the ability to make a profit from the sale of assets.
A higher ratio is preferred as it indicates that the company can use its assets effectively and achieve higher profits. On the other hand, a lower ratio indicates ineffective asset use.
f) Return on Equity (ROE)
Return on Equity measures the returns attributed to the shareholders per dollar invested.

Return on Equity = Net Income / Average Total Equity
Potential and existing shareholders are most interested in this ratio as it can assist them in investment decision-making. Therefore, a higher ratio would attract more investors to the company as they can reasonably expect good and steady returns.
Additionally, ROE can evaluate management efficiency. The management invests the company’s funds within the business for growth opportunities, and an increase in the ratio indicates whether these new activities are beneficial.
g) Return on Capital Employed (ROCE)
Return on Capital Employed measures the effectiveness of generating shareholder returns using the total capital infused into the business.

Return on Capital Employed = EBIT / Capital Employed
EBIT is the Earnings Before Interest and Tax. The interest is not considered for computing the ratio as the level of equity vs debt is not significant.
Equity and debt finance a company. The capital employed is the amount of equity and long-term debt a company has undertaken to finance its activities. It can also be found by deducting the short-term/ current liabilities from the total assets.
This ratio is meant for long-term analysis, and a higher ratio is preferred. It demonstrates that a company can effectively use its resources to generate shareholder returns.
Free Resources
To continue learning and advancing your career, check out these additional helpful WSO resources:


or Want to Sign up with your social account?